CFDs are complex instruments and come with a high risk of losing money rapidly due to leverage. 77.3% of retail investor accounts lose money when trading CFDs with this provider. You should consider whether you understand how CFDs work and whether you can afford to take the high risk of losing your money.
Tuesday May 20 2025 07:03

5 min

According to ECB policymaker Martins Kazaks, European Central Bank (ECB) interest rates may be approaching their lowest point, but uncertainty remains high, and the policy outlook could shift abruptly. The central bank has been reducing rates at a swift pace over the past year, and with inflation projected to settle around the 2% target in the ECB’s baseline scenario, discussions on where to conclude the easing cycle are intensifying.
“If the baseline scenario holds, I believe we are already quite close to the terminal rate,” Kazaks said. “A few additional cuts may still be possible, but what’s crucial is how trade dynamics unfold, and we will respond accordingly,” he added. Market’s expectations reflect this cautious stance. Traders now see around a 90% chance of a rate cut at the ECB’s upcoming meeting on June 5, with only one more cut anticipated for the remainder of the year.

(EUR/USD Daily Chart, Source: Trading View)
From a technical analysis perspective, the EUR/USD currency pair has been in a bullish trend since mid-January 2025, as indicated by the formation of higher highs and higher lows. However, it has recently faced bearish pressure, driving the pair lower, and is now retesting the swap zone at 1.1180 – 1.1220. If it fails to close above this zone, the bearish momentum may continue, potentially pushing the pair lower to retest the support zone at 1.0900 – 1.0950.
Japan’s economy contracted for the first time in a year during the March quarter, shrinking faster than expected and exposing the fragile state of its recovery. Preliminary government data showed real GDP declined by an annualised 0.7% in the January–March period, significantly more than the 0.2% drop forecast by analysts. The downturn was mainly driven by weak private consumption and declining exports, indicating that external demand had already waned even before U.S. President Donald Trump announced sweeping "reciprocal" tariffs on April 2.
While the data offered a slight silver lining, revising fourth-quarter GDP growth upward from 2.2% to 2.4%, concerns over softening domestic demand and escalating trade tensions weighed on the broader outlook. With Japan’s export-driven economy heavily reliant on sectors like automobiles, the threat of U.S. tariffs presents a major headwind. Policymakers now face increasing pressure to respond as global trade uncertainties, spurred by Trump’s protectionist stance, cloud the path ahead.

(USD/JPY Daily Chart, Source: Trading View)
From a technical analysis perspective, the USD/JPY currency pair has been in a bearish trend since mid-January 2025, as indicated by the formation of lower highs and lower lows. However, it has rebounded strongly since the end of April, as shown by the emergence of higher highs and higher lows. Currently, it is retesting the swap zone at 144.70 – 145.30. If it finds support from this zone, it may potentially move higher to retest the resistance zone at 147.90 – 148.60.
Wall Street share futures declined as investor anxiety deepened following Moody’s downgrade of the U.S. credit rating. The move amplified concerns over unpredictable U.S. economic policies and mounting fiscal pressures. Adding to the unease is the nation’s $36 trillion debt load, which could swell further as Republican lawmakers push forward a broad tax cut proposal, estimated by some to potentially increase debt by $3 trillion to $5 trillion over the next decade.
In response to the downgrade, U.S. Treasury Secretary Scott Bessent dismissed its significance in televised interviews yesterday. However, he warned that trade partners could face the harshest tariffs unless they engage in “good faith” negotiations. Bessent is expected to attend this week’s G7 meeting for further discussions.

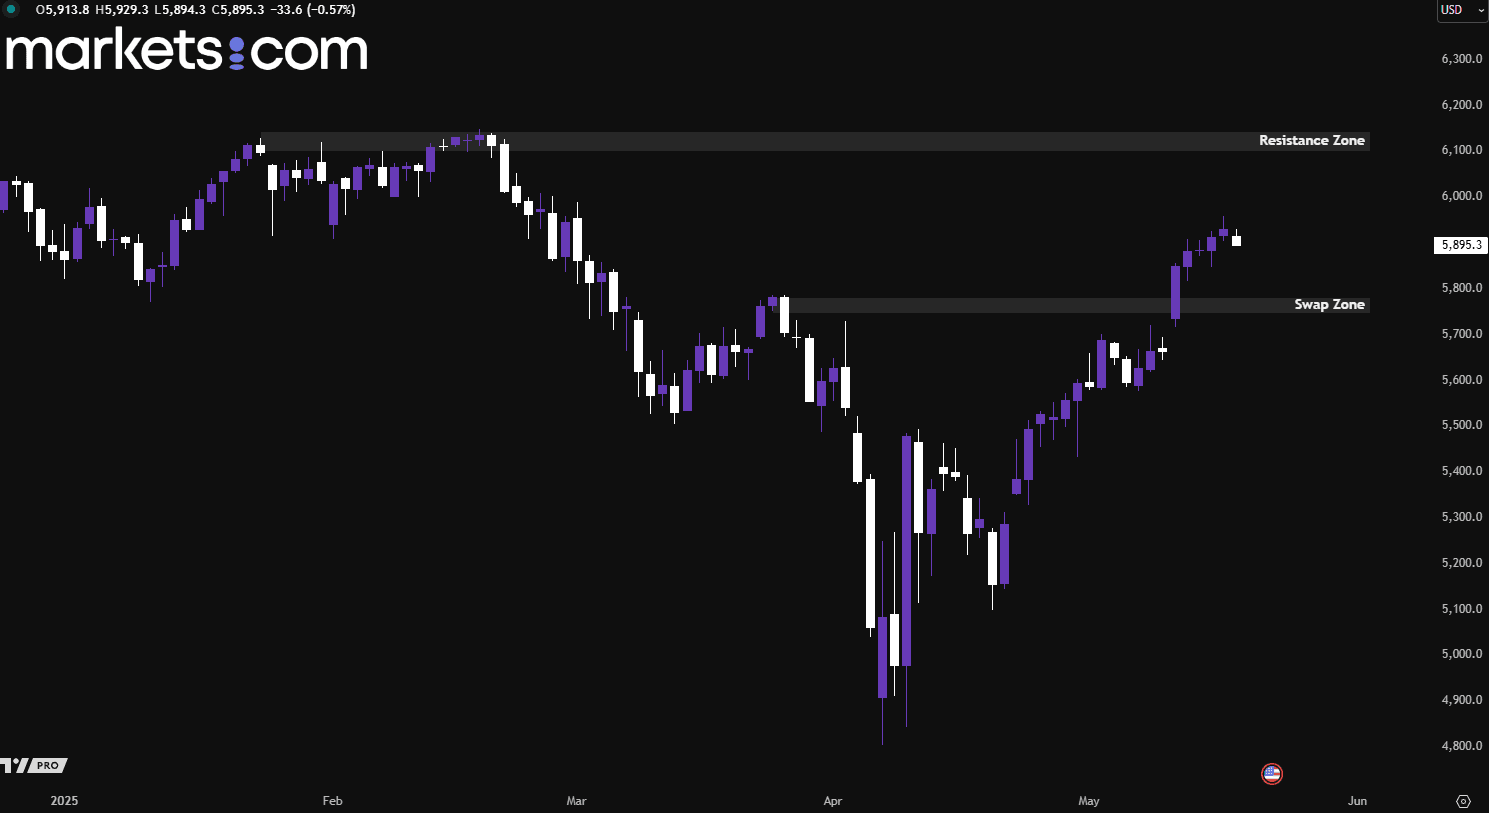
(S&P 500 Index Daily Chart, Source: Trading View)
From a technical analysis perspective, the S&P 500 index has been moving in a bullish trend since beginning of April, as indicated by the higher highs and higher lows. Recently, it has break above the swap zone of 5,750 - 5,780. It is now ranging in between the swap zone and the resistance zone of 6,100 – 6,140. A break of either direction may potentially bring the index to move in that direction.
When considering shares, indices, forex (foreign exchange) and commodities for trading and price predictions, remember that trading CFDs involves a significant degree of risk and could result in capital loss.
Past performance is not indicative of any future results. This information is provided for informative purposes only and should not be construed to be investment advice.