목요일 Jul 24 2025 09:26

6 분

The European Central Bank (ECB) is expected to hold interest rates steady on Thursday, pausing after seven consecutive rate cuts over the past year. The central bank had aggressively reduced its policy rate from 4% to 2% after successfully curbing post-pandemic inflation and the price surge triggered by Russia’s invasion of Ukraine. With inflation now back at the 2% target and forecasted to remain stable, policymakers are opting to wait and assess developments, particularly the outcome of U.S.–EU trade talks ahead of the August 1 deadline.
Markets anticipate one final ECB rate cut by year-end, likely in December. However, uncertainties loom as the ECB braces for potential U.S. tariffs under President Trump’s administration, which could weigh on eurozone growth and suppress inflation in the medium term, especially if the EU refrains from retaliation. The region's economy is already showing signs of stagnation, and while business sentiment remains cautiously optimistic, many firms are beginning to feel the financial strain from existing trade tensions.

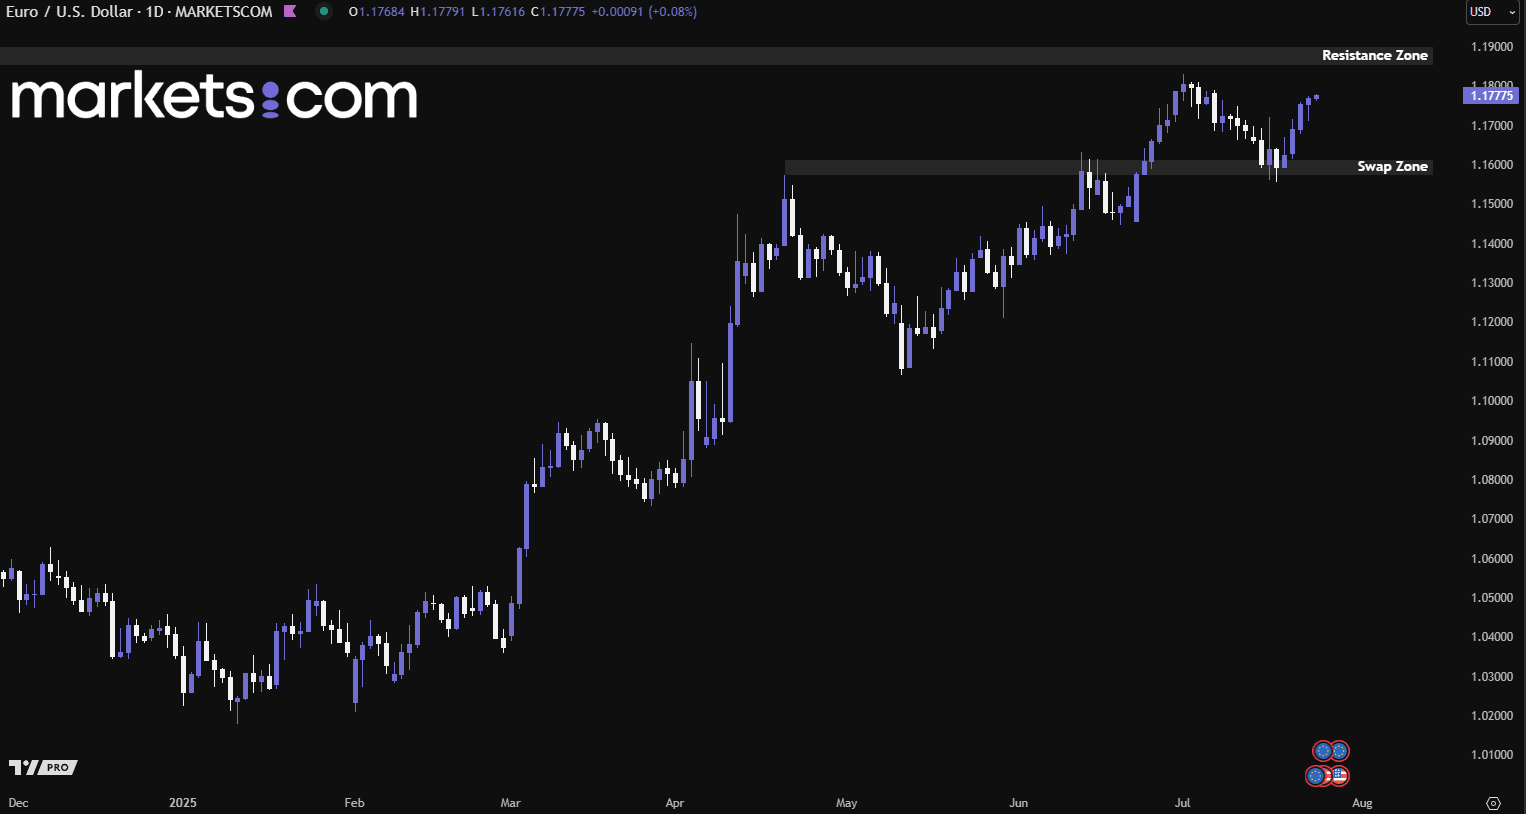
(EUR/USD Daily Chart, Source: Trading View)
From a technical analysis perspective, the EUR/USD currency pair has been trending bullishly since mid-January 2025, as indicated by the formation of higher highs and higher lows. Recently, the pair broke above the swap zone of 1.1570 – 1.1610 at the end of June, pulled back to retest it, found support, and then continued to surge upward. This valid bullish structure could potentially push the pair higher to retest the resistance zone between 1.1850 and 1.1900.
Sterling edged higher against both the U.S. dollar and the euro on Wednesday, buoyed by improved global market sentiment following a trade agreement between the U.S. and Japan. This deal lifted global equities and supported growth-sensitive currencies, such as the pound, which rose to $1.3540, its highest level in nearly two weeks.
Although the pound remains lower against both major currencies for the month of July, some analysts foresee a more positive outlook. Market concerns over the UK’s fiscal position earlier in the month triggered volatility in gilts and pressured the pound, but those fears are easing. Moreover, Bank of America (BofA) analysts noted that the third quarter could bring improvement for the British economy. They believe conditions are ripe for a summer rebound in GBP, though they acknowledge the UK’s fragile public finances.

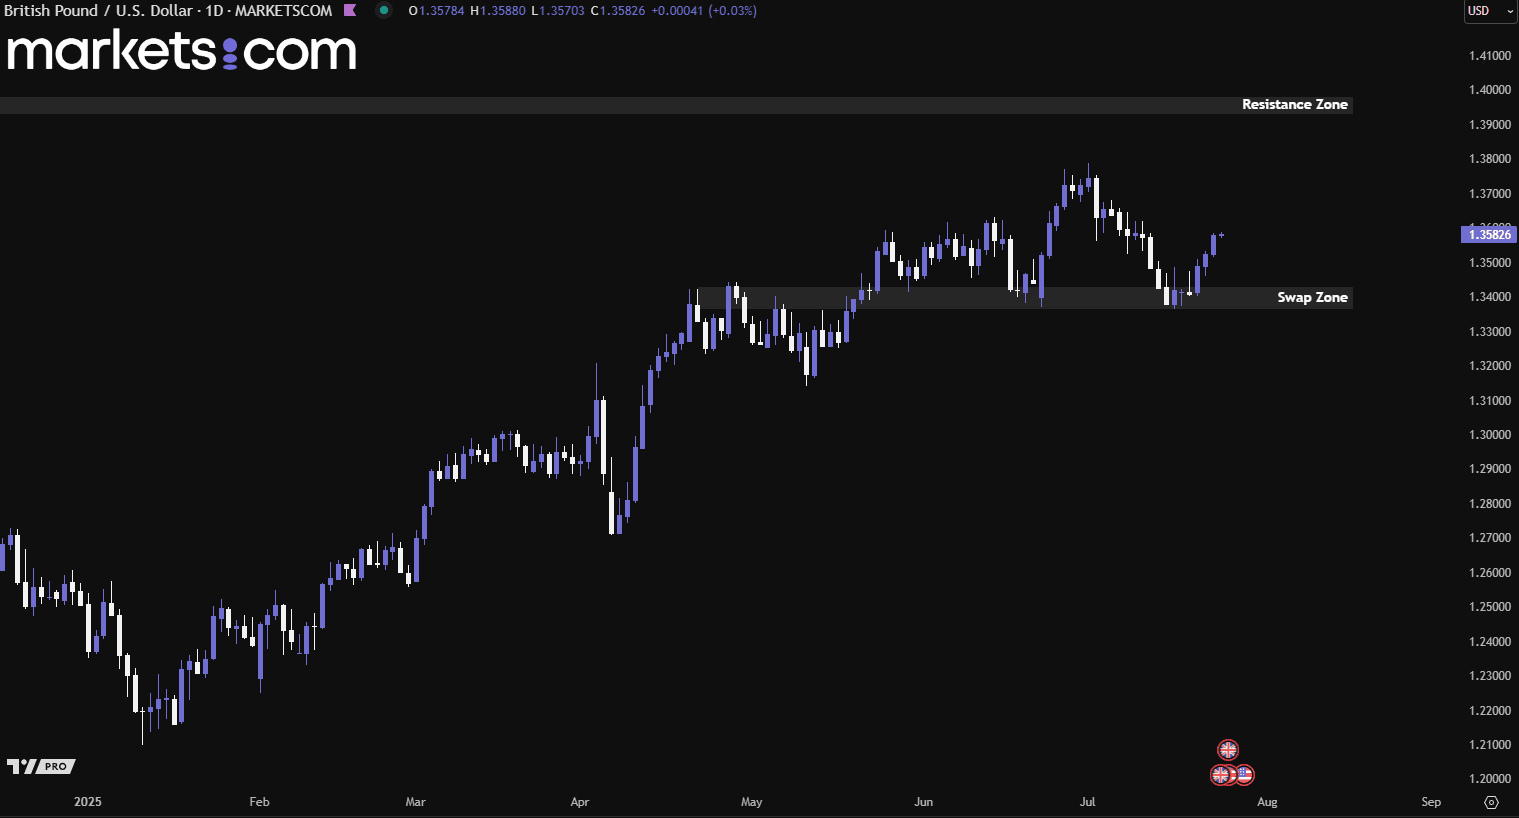
(GBP/USD Daily Chart, Source: Trading View)
From a technical analysis perspective, the GBP/USD currency pair has been trending bullishly since mid-January 2025, as indicated by the formation of higher highs and higher lows. Recently, the pair broke above the swap zone of 1.3365 – 1.3430 at the end of June, pulled back to retest it, found support, and then continued to surge upward. This valid bullish structure could potentially push the pair higher to retest the resistance zone between 1.3930 and 1.3980
Alphabet has defied conventional expectations by achieving rapid growth at a massive scale. Over the past five years, the company has more than doubled its revenue from $166 billion to $371.4 billion, marking an impressive 17.5% annualised growth rate. This outpaced its major tech peers, including Amazon (16.6%), Microsoft (14.4%), and Apple (8%). In its latest quarter, Alphabet reported revenue of $96.43 billion, representing a 13.8% year-over-year increase and surpassing Wall Street estimates by 2.6%.
Google Search, which accounts for 56.1% of Alphabet’s total revenue, grew at a 16.3% annualised rate over the last five years, slightly below the company’s overall pace. Over the past two years, Search revenue growth has moderated to 12.3% annually. However, this deceleration is not seen as a red flag, given the already vast scale of the segment and its continued healthy expansion.

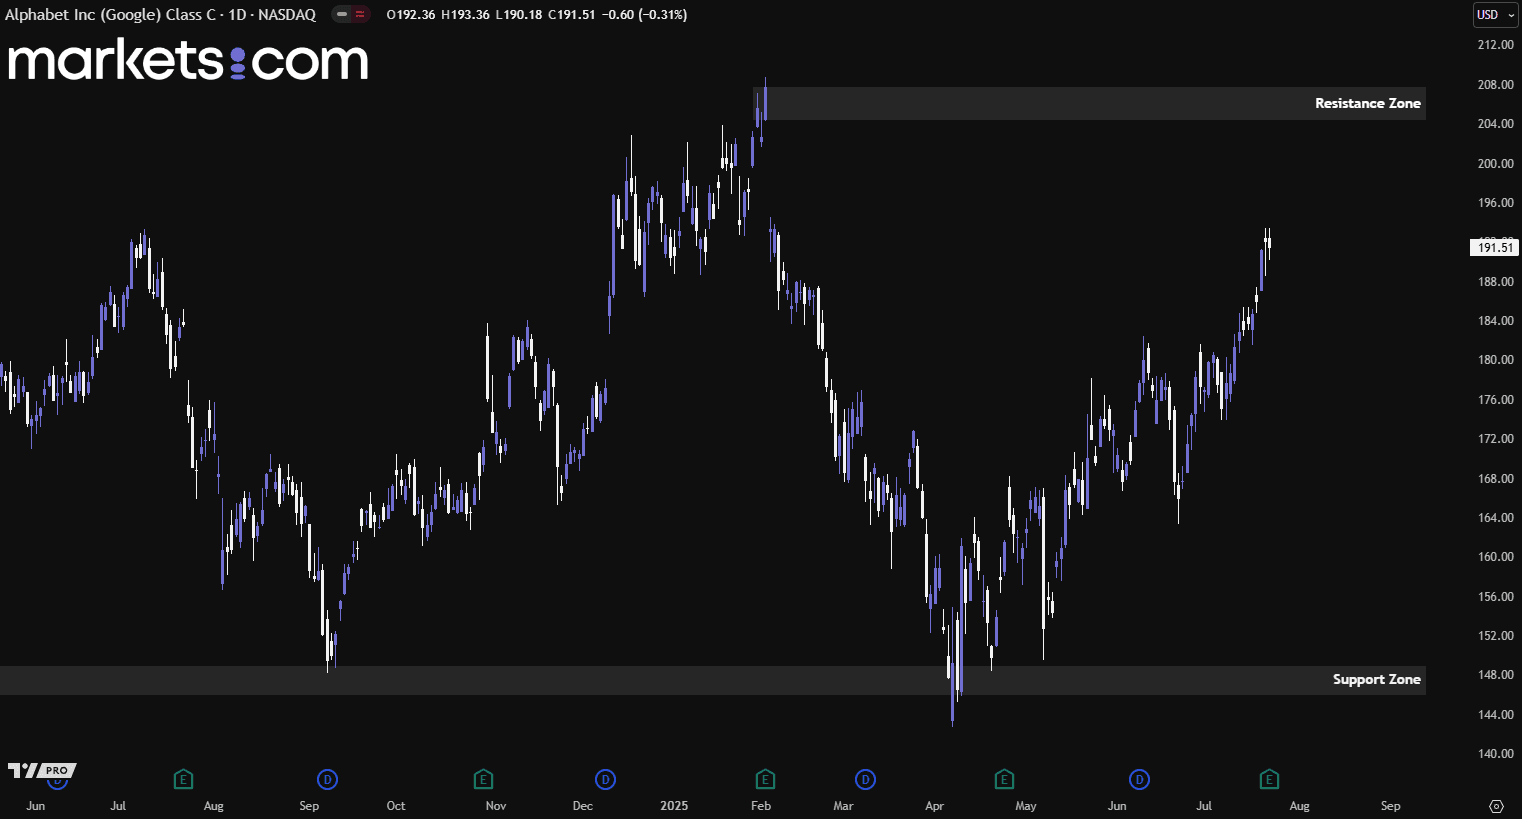
(Alphabet Daily Share Price Chart, Source: Trading View)
From a technical analysis perspective, Alphabet’s share price has rebounded from the support zone of 146 – 149, as indicated by the formation of higher highs and higher lows. The bullish momentum has driven the price upward with strength and is now approaching the resistance zone of 204 – 208. If the price faces rejection and pulls back from this zone, it may signal a potential bearish reversal pattern. Conversely, if the price breaks above this resistance zone with strong bullish momentum, it could potentially continue to surge higher.
When considering shares, indices, forex (foreign exchange) and commodities for trading and price predictions, remember that trading CFDs involves a significant degree of risk and could result in capital loss.
Past performance is not indicative of any future results. This information is provided for informative purposes only and should not be construed as investment advice.
Risk Warning and Disclaimer: This article represents only the author’s views and is for reference only. It does not constitute investment advice or financial guidance, nor does it represent the stance of the Markets.com platform. Trading Contracts for Difference (CFDs) involves high leverage and significant risks. Before making any trading decisions, we recommend consulting a professional financial advisor to assess your financial situation and risk tolerance. Any trading decisions based on this article are at your own risk.