CFD's zijn complexe instrumenten en gaan gepaard met een hoog risico snel kapitaal te verliezen als gevolg van hefboommechanismen. 77.3% an de retailbeleggers lijdt verlies op de handel in CFD's met deze aanbieder. U dient zorgvuldig te overwegen of u begrijpt hoe CFD's werken en of u het zich kunt veroorloven om hoge risico's te nemen op het verliezen van uw kapitaal.
Woensdag Jun 11 2025 09:04

5 min.

The U.S. inflation rate increased by 0.2% month-over-month (MoM) in April, with the same growth expected in May. On a year-over-year (YoY) basis, inflation was 2.3% in April and is projected to rise to 2.5% in May. These data are set to be released today at 12:30 GMT. The unchanged MoM figure suggests that price pressures remain steady, without any major disruptions in short-term trends.
However, the YoY rate is expected to climb due to base effects, last year’s lower inflation readings are now dropping out of the calculation, making the current annual rate appear higher. Additionally, persistent inflation in key areas such as shelter and services may be contributing to the gradual YoY rise. Even with stable monthly gains, these components can keep the annual figure trending higher if core prices remain sticky.

(EUR/USD Daily Chart, Source: Trading View)
From a technical analysis perspective, the EUR/USD currency pair has been in a bullish trend since mid-January 2025, as indicated by a series of higher highs and higher lows. Recently, the pair was rejected at the resistance zone between 1.1530 and 1.1570, causing a temporary pullback. However, it found support at the swap zone of 1.1180 – 1.1210 and has since rebounded, now approaching the resistance area once again.
If the pair fails to break above this resistance zone, a potential double top pattern could form, signaling a possible reversal from a bullish to a bearish trend. Conversely, a successful breakout above the resistance may indicate the continuation of bullish momentum, driving the pair higher. Therefore, the EUR/USD currency pair’s reaction at this key resistance zone will be crucial in determining its next directional move.
Japan’s annual wholesale inflation slowed in May, driven by a decline in import costs for raw materials. This moderation eases some of the pressure on the Bank of Japan (BOJ) to raise interest rates. The Corporate Goods Price Index (CGPI), which tracks prices companies charge each other for goods and services, rose 3.2% year-on-year in May, below the market forecast of a 3.5% increase.
However, wholesale prices for food and beverages accelerated, suggesting that global uncertainties and subdued domestic demand are not preventing firms from passing on higher costs. The BOJ may face limited opportunities to hike rates if overall inflation continues to decelerate by the time ongoing tariff negotiations with the U.S. are resolved.

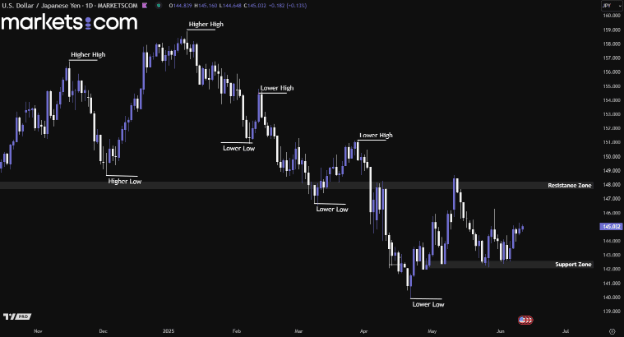
(USD/JPY Daily Chart, Source: Trading View)
From a technical analysis perspective, the USD/JPY currency pair has been moving in a bearish trend since mid-January 2025, as indicated by the pattern of lower highs and lower lows. It rebounded at the end of April 2025 but was rejected at the resistance zone of 147.70 – 148.20, pushing it lower toward retest the support zone of 142.00 – 142.60. Recently, it has found support within this support zone, potentially driving the pair higher to retest the resistance area.
The S&P 500 recorded its sixth gain in seven sessions on Tuesday, buoyed by optimism over trade talks between U.S. and Chinese officials in London. After two days of talks in London, U.S. Commerce Secretary Howard Lutnick said a framework had been agreed to build on last month’s Geneva deal. “We’ll now brief President Trump, and they’ll brief President Xi. If both approve, we’ll move forward,” he stated. China’s Vice Commerce Minister Li Chenggang confirmed a framework was reached in principle, pending approval from both leaders.
Equity markets continued to grind higher while bond yields remained steady, as investor concerns over tariffs and geopolitical risks appeared to ease. Adding to the positive tone, new data pointed to a modest rebound in sentiment among smaller U.S. businesses, supported by reduced tariff anxiety and optimism around President Trump's tax-and-spending initiative. These developments combined to reinforce the market's upward momentum.

(S&P 500 Index Daily Chart, Source: Trading View)
From a technical analysis perspective, the S&P 500 index has been in a bullish trend since early April 2025, rebounding from the support zone of 4,900 – 4,960, as evidenced by a series of higher highs and higher lows. Recently, it broke above the swap zone of 5,800 – 5,850, retested it, found support, and continued moving upward. This valid bullish structure may potentially drive the index toward a retest of the resistance zone at 6,100 – 6,150.
When considering shares, indices, forex (foreign exchange) and commodities for trading and price predictions, remember that trading CFDs involves a significant degree of risk and could result in capital loss.
Past performance is not indicative of any future results. This information is provided for informative purposes only and should not be construed to be investment advice.